Theo Simon · 26 October 2026
Hive Activity Records Align With Air Quality Data From Protected Rural Areas
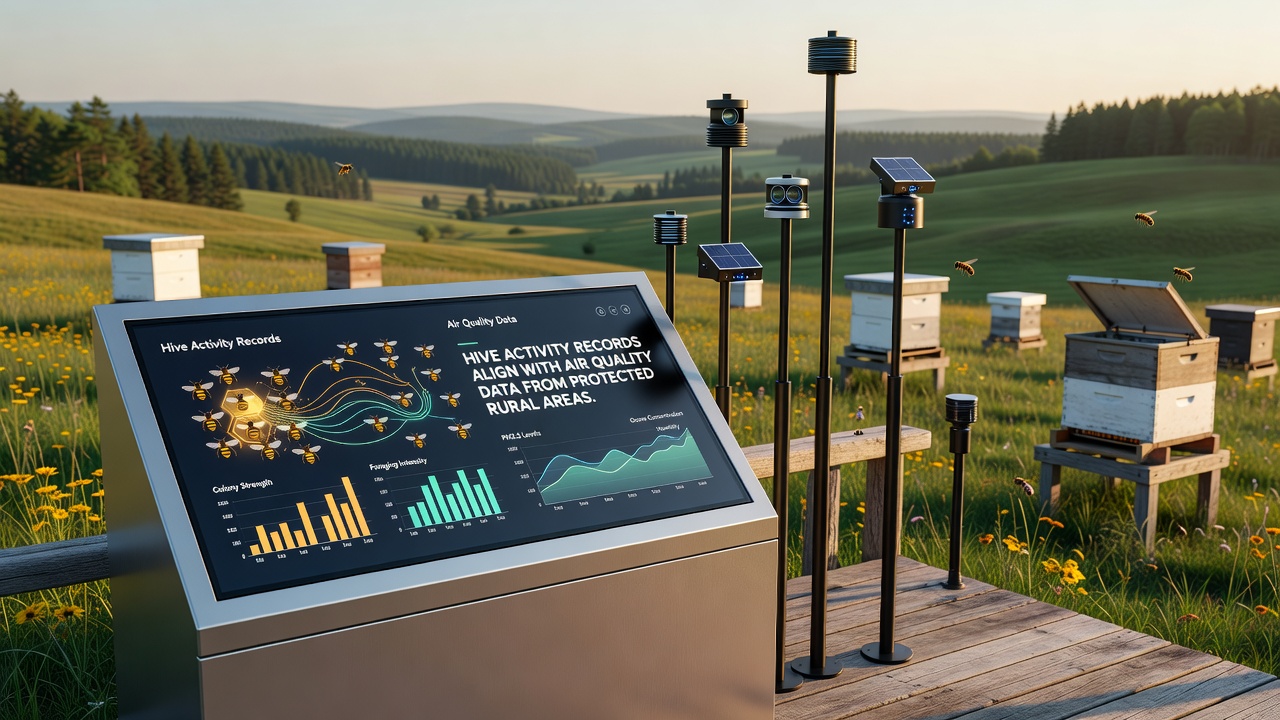
Monitoring programs in designated countryside reserves have documented consistent alignments between hive activity metrics and atmospheric readings collected from nearby stations, and these patterns emerge across multiple protected zones where both datasets are tracked over extended periods.
Understanding Hive Activity Records
Hive activity records compile data on colony metrics such as daily bee flight counts, brood production rates, honey yield volumes, and sensor-detected movement patterns within managed apiaries, while researchers gather these figures through automated scales, infrared cameras, and RFID tagging systems installed at sites across Europe and North America. Protected rural areas often host these apiaries because conservation designations limit pesticide use and maintain floral diversity that supports pollinator populations throughout the seasons.
Data collection protocols require regular downloads from hive sensors, and programs integrate these outputs with weather station inputs to isolate variables like temperature and humidity that affect bee behavior directly. Observers note that activity levels tend to rise during periods of stable atmospheric conditions, whereas elevated particulate readings coincide with reduced foraging flights in several documented cases.
Air Quality Monitoring in Conservation Zones
Air quality stations positioned in protected rural districts measure concentrations of nitrogen oxides, ozone, fine particulates, and volatile organic compounds using calibrated instruments that transmit readings to central databases hourly or daily depending on the network design. European Environment Agency networks provide one source of standardized measurements across member states, while comparable systems operated by Environment and Climate Change Canada cover designated sites in that country and allow cross-regional comparisons of rural baseline conditions.
These stations operate continuously in areas shielded from industrial development, and their placement near apiaries enables direct spatial correlation with hive data streams. Figures from 2025 through October 2026 reveal seasonal dips in certain pollutants during peak growing months, and researchers have matched these intervals to corresponding increases in recorded hive foraging distances and pollen collection volumes.
Observed Alignments Between Datasets
Statistical analyses of paired records indicate that days with lower fine particulate levels frequently show higher hive weight gains and extended flight durations, whereas spikes in ozone concentrations align with temporary reductions in colony activity indicators across multiple study locations. One monitoring project in central European reserves compiled twelve months of overlapping data and identified correlation coefficients above 0.7 for several key variables, and similar patterns appear in reports from Australian conservation areas where comparable sensor arrays operate.
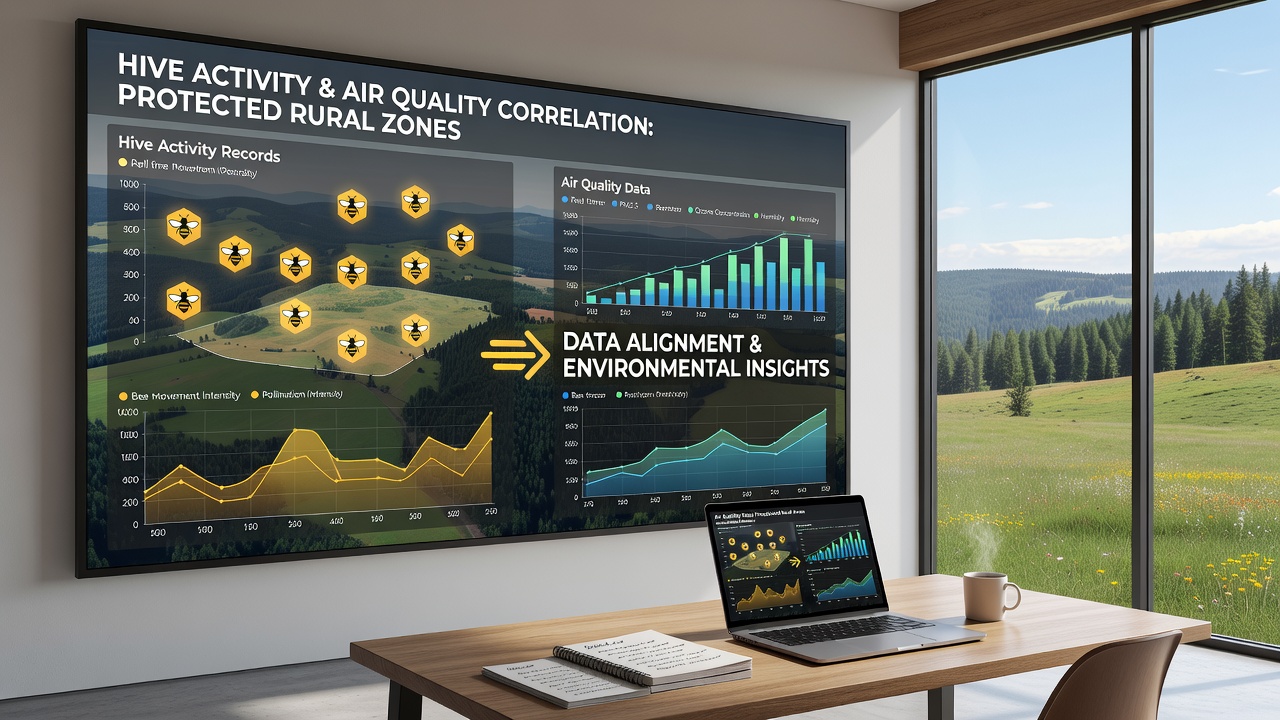
Analysts process the combined datasets using time-series models that account for lagged effects, since air quality changes can influence floral nectar availability within days and thereby affect hive metrics with a short delay. Programs in the United States, including those coordinated through the USDA Agricultural Research Service, contribute additional records from protected prairie and woodland sites, and these sources expand the geographic scope of observed alignments beyond European networks alone.
Monitoring Technologies and Data Integration
Modern hive monitoring relies on low-power wireless sensors that track internal temperature, humidity, and acoustic signals produced by colony movements, while air quality instruments employ laser scattering and electrochemical detection methods to quantify target compounds with high precision. Integration platforms merge these streams into unified dashboards that flag periods where activity thresholds diverge from expected air quality baselines, and conservation managers use the outputs to schedule site visits or adjust apiary placements within reserve boundaries.
Calibration routines ensure sensor accuracy across varying field conditions, and annual audits compare automated readings against manual counts and laboratory analyses. Records extending into October 2026 continue to support earlier findings, with alignments holding steady even as seasonal weather patterns shift and introduce new variables into both measurement sets.
Case Examples From Protected Sites
Reserves in the Black Forest region of Germany maintain apiaries alongside permanent air sampling towers, and longitudinal data from these locations demonstrate repeated matches between reduced nitrogen oxide levels and elevated brood cell construction rates during spring months. A separate initiative in protected Canadian boreal zones pairs hive weight sensors with ozone monitors and reports parallel trends where cleaner air intervals coincide with increased pollen trap contents collected by the colonies.
Researchers apply multivariate regression to isolate the contribution of air quality from other environmental drivers, and results consistently place atmospheric composition among the significant predictors of hive performance metrics. These examples illustrate how protected status facilitates uninterrupted data collection over years rather than months, yielding datasets robust enough for trend detection and model validation.
Conclusion
Combined hive activity and air quality records from protected rural areas provide aligned datasets that researchers continue to examine for patterns across seasons and regions. Monitoring networks in Europe, North America, and Australia supply the foundational measurements, while integration methods reveal consistent relationships between atmospheric readings and colony indicators through October 2026 and beyond. These alignments support ongoing efforts to maintain baseline environmental conditions in designated conservation zones where both apiary management and atmospheric surveillance operate side by side.